
A Practical AWS Cost Review: Where to Look Before You Resize Anything
Begin with the bill, not the instance list
A cost review often starts with a table of EC2 instance sizes. That is attractive because the action is concrete, but it can miss the largest drivers and create reliability risk for modest savings. AWS charges across compute time, storage capacity and operations, network paths, managed-service dimensions, support, software licenses, and contractual commitments. The first task is to explain the bill in those terms.
Choose a stable review window, usually at least one complete month plus several prior months for comparison. Separate recurring usage from one-time charges, credits, refunds, taxes, and support. Confirm whether the figures are amortized, unblended, or net of discounts. Mixing these views can make the same workload appear to have different costs.
Cost Explorer is useful for initial slicing. The Cost and Usage Report, delivered to S3 and queried with Athena, provides line-item detail when tags, usage types, or commitment allocation need closer inspection.
aws ce get-cost-and-usage \
  --time-period Start=2026-07-01,End=2026-08-01 \
  --granularity MONTHLY \
  --metrics AmortizedCost UsageQuantity \
  --group-by \
    Type=DIMENSION,Key=SERVICE \
    Type=DIMENSION,Key=USAGE_TYPE
Do not add UsageQuantity across unlike units. GB-month, requests, hours, and data-transfer GB are not commensurate. Use quantity only inside a known usage type.
Map billing dimensions to architecture
For each material line item, identify the resource, account, region, environment, owner, and architectural behavior that produces it. A service-level total is useful, but the usage type often tells the actionable story.
EC2 may include instance hours, CPU credits, dedicated tenancy, Elastic IP charges, and data transfer. EBS includes provisioned capacity, IOPS, throughput, and snapshots. RDS includes instance time, storage, I/O for some engines and configurations, backup storage, and transfer. Lambda includes requests, duration, architecture, provisioned concurrency, and ephemeral storage. NAT Gateway includes gateway hours and every processed GB, in addition to other applicable transfer charges.
Build a cost map rather than a top-ten list. If NAT processing is high, determine which private subnets, destinations, and workloads create the bytes. If S3 request cost is high, separate GET, PUT, lifecycle transition, retrieval, and inventory activity. A bill line without an architectural path is not yet a finding.
Tag coverage affects how far this analysis can go. Cost allocation tags only help after activation, and they do not repair old line items. Account boundaries, resource IDs in the Cost and Usage Report, Kubernetes allocation data, and deployment metadata may be needed to attribute shared costs.
Remove idle resources before tuning busy ones
Idle resources are usually lower-risk targets than active production capacity. Search for unattached EBS volumes, old snapshots, unused load balancers, idle NAT gateways, unattached Elastic IP addresses, stopped instances retaining storage, abandoned development databases, old container images, and log groups with indefinite retention.
Idle does not mean safe to delete. A detached volume may be a deliberate recovery artifact. A quiet load balancer may serve a low-frequency critical endpoint. Require an owner, age threshold, dependency check, and recoverability plan before removal.
aws ec2 describe-volumes \
  --filters Name=status,Values=available \
  --query 'Volumes[].{Id:VolumeId,GiB:Size,Created:CreateTime,AZ:AvailabilityZone}'

aws ec2 describe-addresses \
  --query 'Addresses[?AssociationId==null].{Allocation:AllocationId,IP:PublicIp}'

aws elbv2 describe-load-balancers \
  --query 'LoadBalancers[].{Name:LoadBalancerName,Type:Type,Created:CreatedTime}'
These commands produce candidates, not deletion approvals. Check CloudTrail, CloudWatch traffic, infrastructure state, DNS, backup policy, and ownership records. Tag candidates, notify owners, wait through an agreed observation period, then remove them through the system that created them. Deleting a Terraform-managed resource directly only creates drift.
For S3 and ECR, retention policy matters more than a one-time cleanup. Lifecycle rules can expire incomplete multipart uploads, transition eligible objects, and cap unneeded image history. Validate retrieval needs and minimum storage-duration charges before moving objects into colder classes.
Trace data transfer as a path
Data transfer costs are easy to underestimate because one request may cross several billable boundaries. Draw the actual path: client, CDN, load balancer, availability zone, workload, NAT gateway, managed service, and destination. Mark region and availability zone at each hop.
Common drivers include internet egress, cross-region replication, inter-AZ traffic between clients and services, NAT Gateway processing, public endpoints reached from private subnets, and centralized inspection architectures. The correct remedy depends on the path. Moving a NAT gateway or adding one per availability zone may reduce cross-AZ traffic but add hourly gateway cost. The decision requires both terms.
A simple monthly comparison can be written as:
current_cost = nat_hourly + nat_processed_gb * nat_rate
             + cross_az_gb * cross_az_rate

proposed_cost = gateway_count * nat_hourly
              + remaining_nat_gb * nat_rate
              + endpoint_hourly
              + endpoint_processed_gb * endpoint_rate
Use current regional prices and account-specific discounts rather than copying example rates. Include both directions where AWS bills both sides of a transfer. For S3, DynamoDB, ECR, STS, and other AWS services, evaluate gateway or interface endpoints and direct service integration. An endpoint is not automatically cheaper. Interface endpoints have hourly and data processing charges, and their value depends on traffic and topology.
Flow Logs, NAT Gateway metrics, load balancer logs, CDN reports, and the Cost and Usage Report can help bind bytes to paths. Sampled network evidence is better than inferring the source from a single billing label.
Understand commitments before buying more
Savings Plans and Reserved Instances exchange flexibility for a lower effective rate on eligible usage. They should follow workload cleanup and demand analysis, not precede them. A commitment purchased against waste makes the waste cheaper and harder to remove.
Inventory existing commitments first. Review hourly commitment, utilization, coverage, term, payment option, scope, expiration, and the workloads receiving the benefit. Use amortized cost when comparing committed and on-demand usage because upfront payments must be spread across the term.
Coverage and utilization answer different questions. Coverage asks how much eligible usage received a commitment benefit. Utilization asks how much of the purchased commitment was consumed. High utilization with low coverage can indicate room for another commitment. Low utilization indicates that the current commitment is already too large or poorly matched.
Model a conservative baseline, not peak demand. Exclude workloads scheduled for retirement, architecture changes, acquisitions that are not approved, and temporary migration overlap. Keep variable or uncertain demand on flexible pricing. Consider the option value of waiting when an application may move to Graviton, containers, serverless, or another region.
A purchase case should show the formula:
on_demand_baseline = eligible_hours * effective_on_demand_rate
committed_baseline = commitment_cost + uncovered_usage_cost
expected_savings   = on_demand_baseline - committed_baseline
break_even_months  = upfront_payment / monthly_net_savings
Include fees, expected utilization, and the cost of unused commitment. Do not present the provider's maximum discount as the expected saving.
Right-size from workload evidence
After idle capacity, transfer paths, and commitments are understood, right-sizing becomes safer. Collect enough history to include weekday patterns, batch windows, deployments, month-end processing, and seasonal peaks relevant to the service.
CPU alone is inadequate. Review memory, network packets and throughput, EBS IOPS and queue depth, disk space, connection counts, garbage collection, throttling, latency, and application concurrency. Standard EC2 metrics do not include memory without an agent or another telemetry source. Burstable instances also require CPU credit analysis.
Use percentiles and maxima with context. A low average can hide a short but essential processing window. Determine whether the service scales horizontally, whether instances share load evenly, and how quickly replacement capacity becomes ready. For stateful systems, changing instance class can alter network and storage ceilings even when CPU remains low.
A right-sizing proposal should state current shape, proposed shape, observed headroom, limiting dimension, expected monthly change, failure risk, rollback trigger, and test window. Apply one class of change at a time. Changing instance family, architecture, storage type, and autoscaling policy together makes attribution difficult.
Express cost in units the business system produces
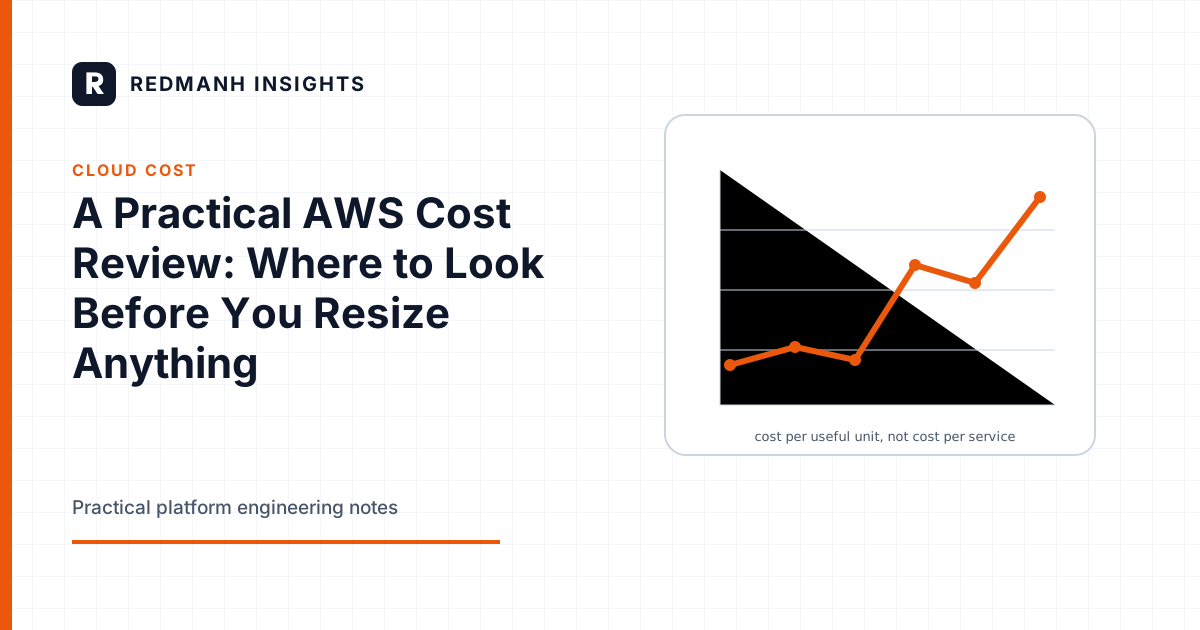
Total cloud spend shows direction but not efficiency. Unit economics connects cost to useful output: cost per API request, order, active tenant, build minute, gigabyte processed, or inference. The unit must reflect actual work and remain stable enough for comparison.
Start with an explicit allocation model:
service_cost = direct_tagged_cost
             + allocated_shared_platform_cost
             + allocated_network_cost

cost_per_order = service_cost / completed_valid_orders
State how shared costs are allocated. Equal division, request share, CPU share, and revenue share produce different results. There is no universally correct denominator. The allocation should be consistent and appropriate to the decision.
Protect the denominator from partial or invalid events. If retries inflate request count, cost per request may appear to improve while customer work stays flat. Pair unit cost with quality and reliability measures so an outage does not look like a successful cost reduction.
Sequence changes to preserve evidence
- Fix allocation, time range, and cost view so the baseline is reproducible.
- Identify owners and architectural paths for material line items.
- Quarantine and remove verified idle resources.
- Correct avoidable transfer and retention patterns.
- Measure active workloads across all limiting dimensions.
- Right-size in controlled batches with rollback criteria.
- Purchase commitments only for the remaining conservative baseline.
- Track total and unit cost alongside reliability after each change.
Record each action with an expected monthly effect and compare it with the next complete billing period. Some AWS charges arrive late or are redistributed by discounts, so same-day dashboards may not prove realized savings. Keep the calculation and the observed bill side by side.
The purpose of the review is not to produce a list of smaller instances. It is to explain why the bill exists, remove cost that produces no useful work, and change active systems without damaging their operating margin or reliability.
Need this built properly?
Redmanh LLC designs and operates Kubernetes platforms, Terraform managed infrastructure, and release pipelines for private and public sector teams.
Start a conversationRelated articles
Infrastructure as Code
A Safe Terraform State Migration Playbook
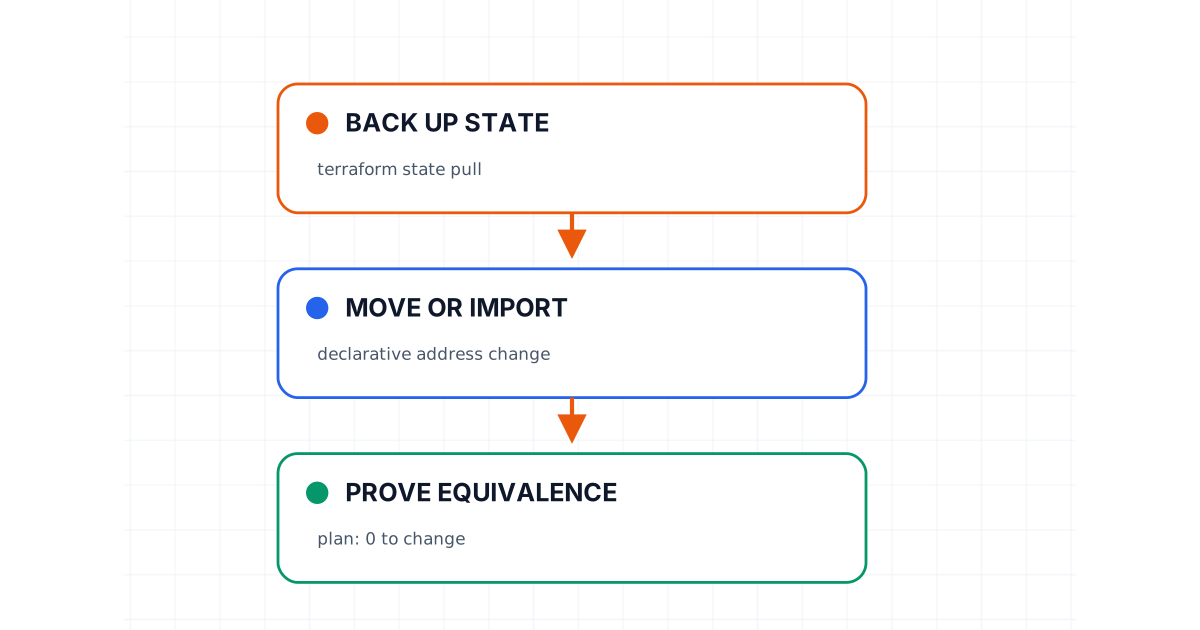
Move Terraform state without gambling on production: back up, verify locks, map addresses, prove plan equivalence, and preserve a tested rollback path.
8 min read
Kubernetes
Planning an EKS Upgrade Without Turning It Into an Incident
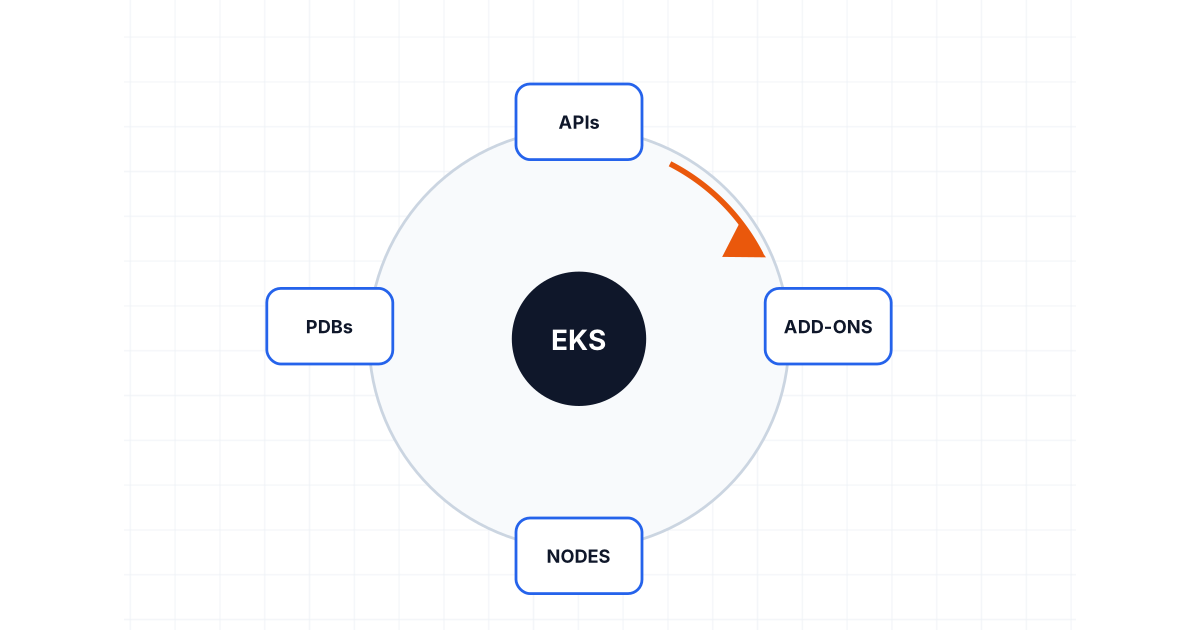
Upgrade EKS with explicit checks for skew, deprecated APIs, add-ons, disruption budgets, replacement nodes, canaries, observability, and rollback limits.
8 min read
Delivery Engineering
Rollback Is a Feature: Designing CI/CD Pipelines That Can Recover
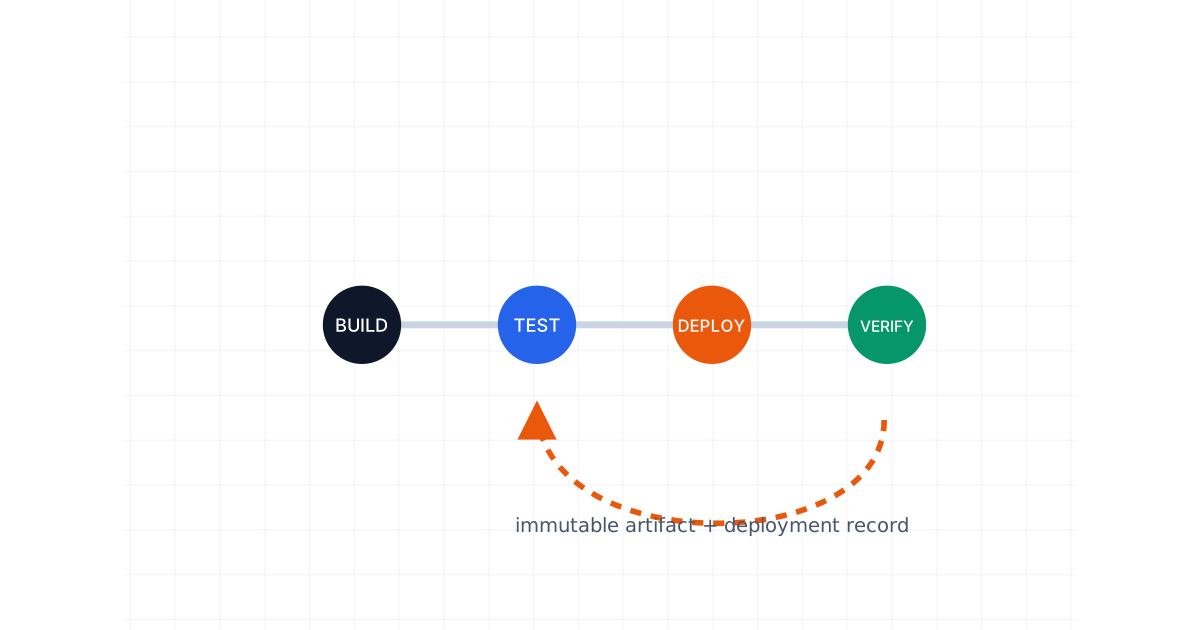
Build recovery into CI/CD with immutable artifacts, deployment records, compatible database changes, progressive delivery, flags, drills, and evidence.
8 min read